ATLAS: The Knowledge Graph That Makes Research Intelligence Cumulative
#intelligence#knowledge graph#AI#OAIRA#deep research
David Olsson
Most research produces findings. ATLAS produces a knowledge graph.
The difference is accumulation. Findings answer a question and then expire — they age, they're superseded, they get filed in a slide deck and forgotten. A knowledge graph captures the relationships between entities and compounds over time: each new piece of research adds to a permanent, queryable understanding of the domain.
ATLAS is OAIRA's graph intelligence layer. It turns your research content, documents, and simulations into a structured, visual, traversable map of everything you know.
How ATLAS Builds the Graph
ATLAS runs a three-stage pipeline:
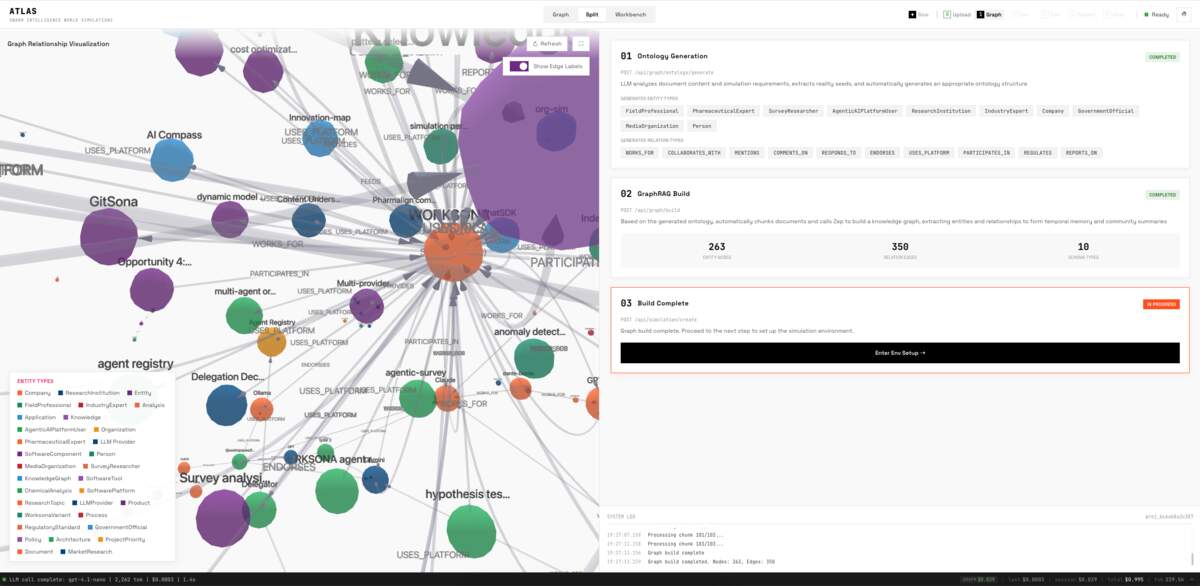
01. Ontology Generation ATLAS analyzes document content and simulation requirements, extracts entity seeds, and automatically generates an appropriate ontology structure. This includes:
- Entity types: Company, ResearchInstitution, FieldProfessional, IndustryExpert, SurveyResearcher, AgentAILLMPlatform, Person, MediaOrganization, and more
- Relationship types: WORKS_FOR, COLLABORATES_WITH, MENTIONS, COMMENTS_ON, ENDORSES, USES_PLATFORM, PARTICIPATES_IN, REGULATES, REPORTS_ON
The ontology is domain-specific. An AI tools research domain produces a different ontology than a pharmaceutical market research domain or a regulatory environment study.
02. GraphRAG Build Based on the generated ontology, ATLAS automatically chunks documents and calls Zep to build a knowledge graph — extracting entities and relationships to form temporal memory and community summaries. In the example run visible in the platform, this produced:
- 263 fragments — the granular evidence units
- 350 relationships — edges between entities
- 10 communities — clusters of related entities that form meaningful groupings
03. Graph Complete Atlas enters simulation-ready state. The graph can be queried, visualized, and traversed. New documents and simulations can be added and integrated into the existing graph structure without rebuilding from scratch.
The Visualization
ATLAS renders the knowledge graph as an interactive force-directed network. Each node is an entity — color-coded by type. Edges represent relationships. Node size reflects connectivity — highly-connected entities are larger.
In a research domain covering the AI tools and market research ecosystem, the graph reveals its own structure:
- Central hub nodes: OAIRA-adjacent platforms and research organizations with dense connection patterns
- Spoke nodes: individual professionals, companies, and tools with more targeted relationships
- Community clusters: groups of entities that consistently co-occur and reference each other
The "Show Edge Labels" toggle reveals relationship types on every edge — USES_PLATFORM, WORKS_FOR, PARTICIPATES_IN, and so on. You can read the graph as structured knowledge, not just as a visualization.
What You Can Do With the Graph
Once the graph is built, several use cases open up:
Entity lookup. Who in your graph is connected to a specific platform, topic, or organization? The graph answers this as a traversal, not a search.
Community analysis. Which clusters of entities are tightly connected? These communities often represent market segments, influence networks, or competitive clusters that aren't obvious from reading documents sequentially.
Gap identification. What entity types are present but poorly connected? Sparse nodes in a domain where you'd expect density signal gaps in your research coverage.
Relationship mapping. How does entity A connect to entity B, and through what intermediaries? In competitive research, this is how you map influence paths and identify non-obvious relationships.
Temporal tracking. As new research is added to the graph, relationship patterns change. ATLAS tracks these changes, giving you a record of how the domain is evolving.
Graph Modes: Graph, Split, Workbench
ATLAS offers three interface modes:
- Graph — Full-screen visualization with entity type legend and relationship filter controls
- Split — Graph on the left, pipeline status and entity details on the right. The working view during a build run.
- Workbench — Query and analysis interface for structured exploration of the graph data
Research Intelligence That Compounds
The key property of a knowledge graph is that it accumulates. Every new document you process, every simulation you run, every source you feed to ATLAS makes the graph richer.
Traditional research produces a series of point-in-time outputs. Each study is essentially independent — it answers its question and closes. ATLAS makes research cumulative. The second study builds on the first. The tenth study builds on the previous nine. The graph gets denser, more connected, more reliable as evidence accumulates.
This is the shift from research as a series of projects to research as a continuous, evolving intelligence asset. ATLAS is where that asset lives.
OAIRA is an AI-powered market research platform. ATLAS is available in the Labs section and supports documents, web content, and simulation outputs as graph inputs.