Surveys That Know What They're For: The OAIRA Survey System
#surveys#research design#OAIRA#market research
David Olsson
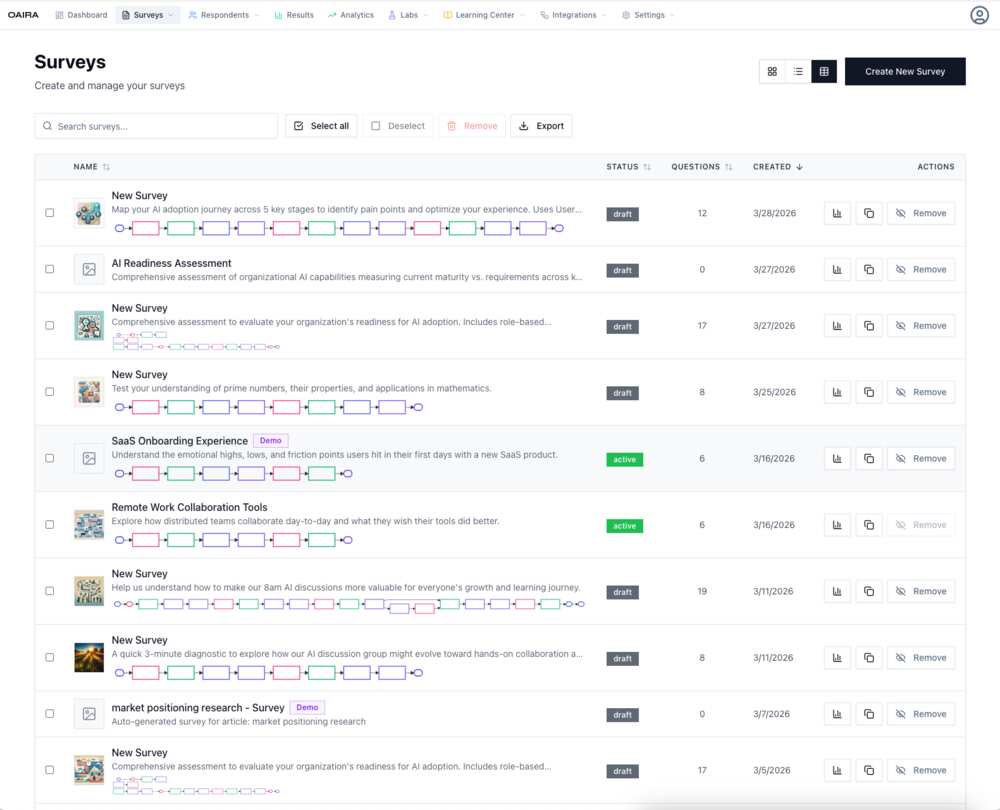
Look at a list of surveys in any traditional platform and you'll see the same thing: a name, a status (live/closed), a response count. Maybe a date.
OAIRA's survey list is different. Each entry carries its research goal, AI-generated cover image, branching flow visualization, question count, and status. You're not looking at a list of forms. You're looking at a portfolio of research instruments, each contextualized by what it's trying to understand.
The difference isn't cosmetic. It reflects a different model for what a survey is.
Research Methodology as First-Class Data
Every survey in OAIRA is associated with a research methodology. The platform supports eight:
- Jobs to Be Done (JTBD)
- User Journey Mapping
- Audience Segmentation
- Hypothesis Testing
- Comparative Analysis
- Sentiment & Opinion
- Gap Analysis
- Exploratory Discovery
Methodology isn't a label or a tag. It shapes how the survey is generated, how questions are structured, and how results are analyzed. An AI adoption journey survey built on the User Journey methodology will produce fundamentally different questions — and fundamentally different analysis — than the same topic built on Gap Analysis.
This means when you look at a survey in OAIRA, you know not just what it asks but why it asks it that way.
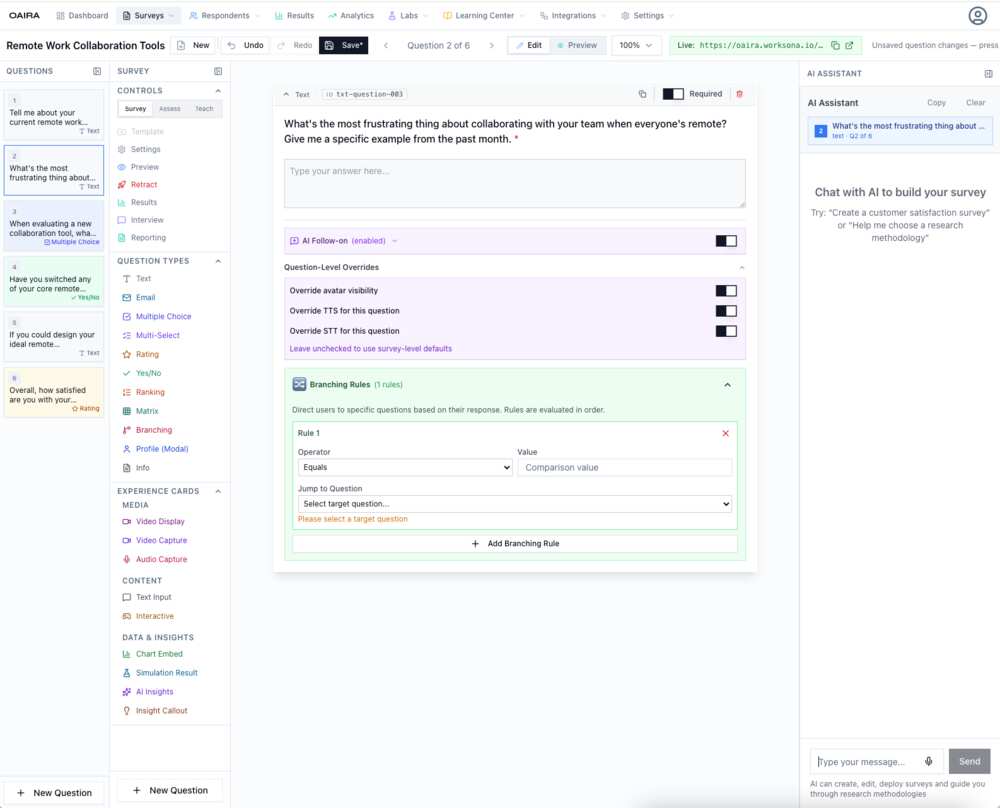
Branching Logic, Visualized
Under each survey card in the system view, OAIRA renders a miniature flow diagram — a visual representation of the survey's branching structure. You can see at a glance whether a survey is linear, mildly branching, or complex.
This matters for research design at scale. When you're managing dozens of active studies, knowing the structural complexity of each instrument without opening it is a non-trivial capability. You can spot surveys that have become overly complicated, identify linear studies that might benefit from adaptive branching, and audit your portfolio's design patterns in a single view.
AI Cover Images
Every survey gets a generated cover image — not a random decoration, but a visual shorthand derived from the survey's topic and research goal. An AI adoption survey gets a different image than an onboarding experience study or a remote work tools survey.
This is a small thing that turns out to matter a lot in practice. When you're navigating a large research portfolio, visual differentiation reduces cognitive load. You recognize the AI readiness study not by parsing the title but by the visual. The image encodes meaning.
Managing Research at Scale
The survey management interface is built for teams running multiple concurrent studies:
- Search across all surveys by name or content
- Bulk select for multi-survey operations
- Status tracking — draft, active, closed — with clear visual indicators
- Question counts surfaced at the list level — no need to open each survey
- Export for bulk data operations
- Demo flagging — mark template surveys separately from active research
These are the operational details that make the difference between a platform that works for one study and one that works for a research program.
From Single Survey to Research Portfolio
Traditional survey tools are optimized for the single study. Create it, deploy it, close it, move on. The system has no memory of what came before and no awareness of what you're trying to learn across studies.
OAIRA is designed around the research portfolio. Your surveys share a common methodology framework, a common respondent universe, and a common analytical substrate. A finding in one study can become the hypothesis for the next. Segments identified in an exploratory study can become the target population for a comparative analysis.
The survey system is where this portfolio lives. It's not a form archive. It's a research program.
OAIRA is an AI-powered market research platform supporting eight research methodologies. Surveys are one instrument in a broader research portfolio that includes simulations, AI interviews, and deep research pipelines.